
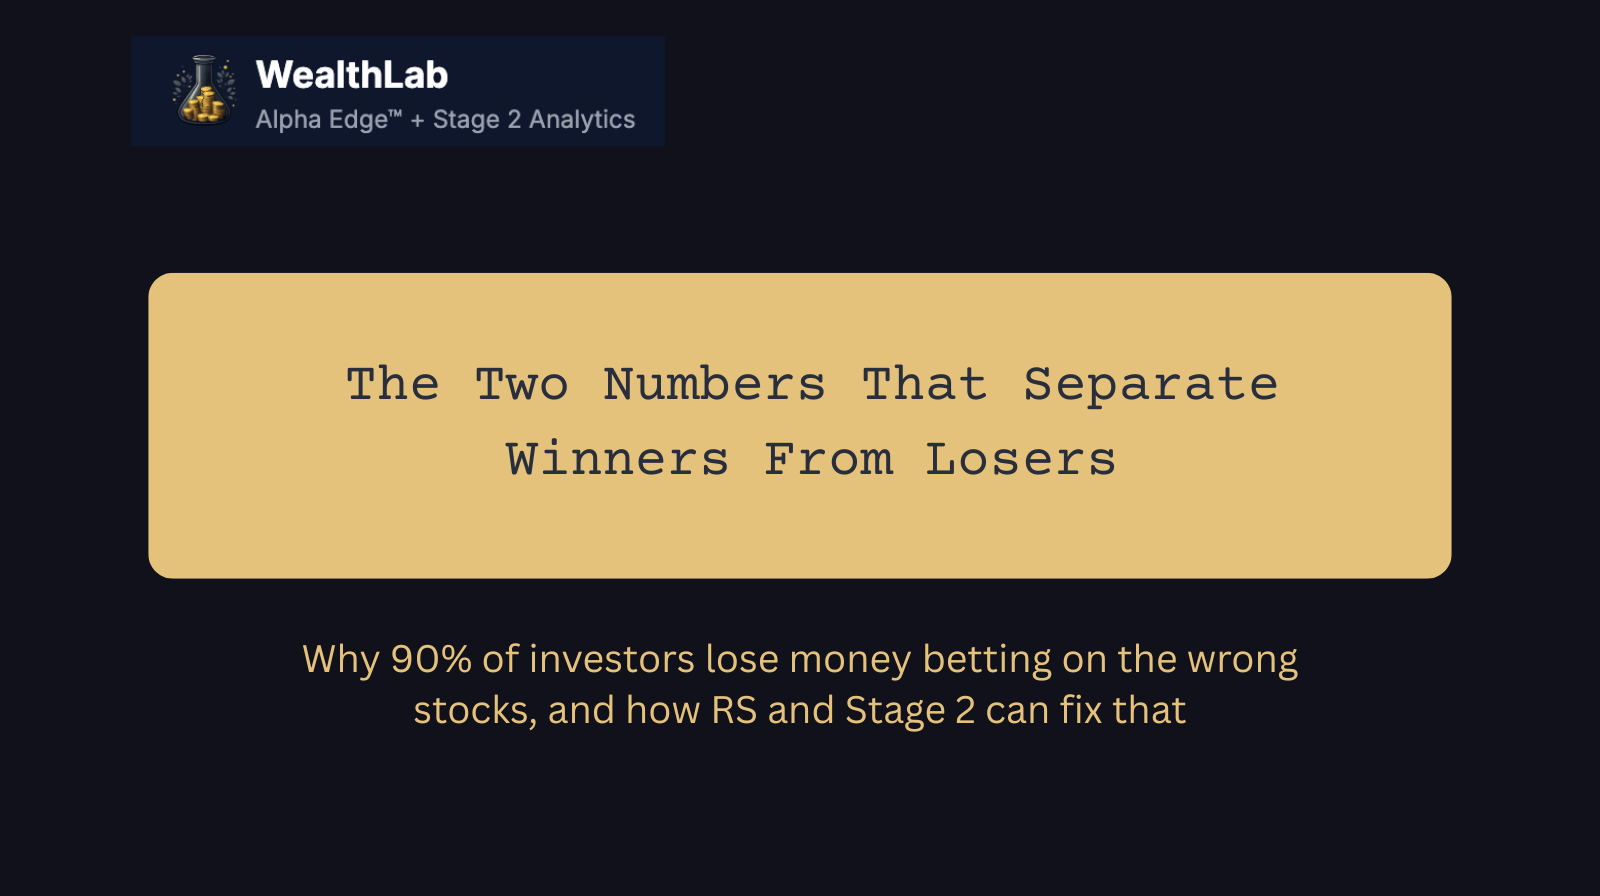
The Two Numbers That Separate Winners From Losers
Why 90% of investors lose money betting on the wrong stocks, and how RS and Stage 2 can fix that

"The stock market is a device for transferring money from the impatient to the patient."
– Warren Buffett
Today is February 2nd, and I’m willing to bet that if you check your portfolio right now, you’ll see a sea of red.
Why?
Because most investors are holding stocks that used to perform. They’re sitting on yesterday’s winners, hoping they’ll come back. They’re watching their capital slowly bleed out, wondering when things will “turn around.”
Here’s the brutal truth: Those stocks aren’t coming back. At least not anytime soon.
And while you’re waiting, you’re missing the stocks that are actually performing right now. Today. This week. This month.
The difference between these two groups?
Two simple metrics: Relative Strength (RS) and Stage 2
If you’ve been reading my previous posts, you’ve seen me mention these terms. You know they matter. But do you really understand what they mean? And more importantly, do you understand why they work?
Today, we’re going deep. By the end of this piece, you’ll understand:
What RS and Stage 2 actually measure
Why institutions obsess over these metrics
How to use them to find stocks before they explode
The exact thresholds that separate leaders from laggards
So grab your coffee (or tea, I don’t judge), and let’s get started.
The Marathon Analogy: Understanding Relative Strength
Imagine you’re watching a marathon. There are 2,000 runners on the track.
Some are sprinting ahead. Some are maintaining a steady pace in the middle of the pack. Some are struggling at the back, gasping for air.
Now, here’s the question: Which runner do you bet on to win?
The obvious answer? One of the front-runners.
You wouldn’t bet on someone currently ranked 1,500th, right? Even if they have “potential” or they “used to be fast” or someone told you they’re “undervalued.”
The stock market works exactly the same way.
Relative Strength (RS) is your ranking system for this race.
What Is Relative Strength?
RS Rating is a score from 0 to 100 that tells you how a stock is performing compared to all other stocks in the market.
Let’s break it down:
RS 90 = This stock is outperforming 90% of the market
RS 50 = Average performance (middle of the pack)
RS 20 = Underperforming 80% of the market
On WealthLab, we track over 2,000 stocks. So if a stock has an RS of 90, it means it’s running faster than 1,800+ other stocks.
Why Does RS Matter?
Here’s a concept that changed my investing life:
Leaders keep leading. Laggards keep lagging.
It’s not always true. But it’s true most of the time. And in the stock market, “most of the time” is all you need to make serious money.
Think about it like momentum in sports:
When a cricket team is on a winning streak, they tend to keep winning
When a runner takes the lead in a race, they usually maintain it (at least for a while)
When a stock starts outperforming, institutions notice, and they pile in
This creates a self-reinforcing cycle:
Stock performs well → RS increases
High RS catches institutional attention
Institutions buy → Stock performs even better
RS increases further → More institutions notice
And so on...
This is why we only focus on stocks with RS > 80.
Why 80? Because that’s the top 20%. That’s where the real money is flowing. That’s where institutions are accumulating.
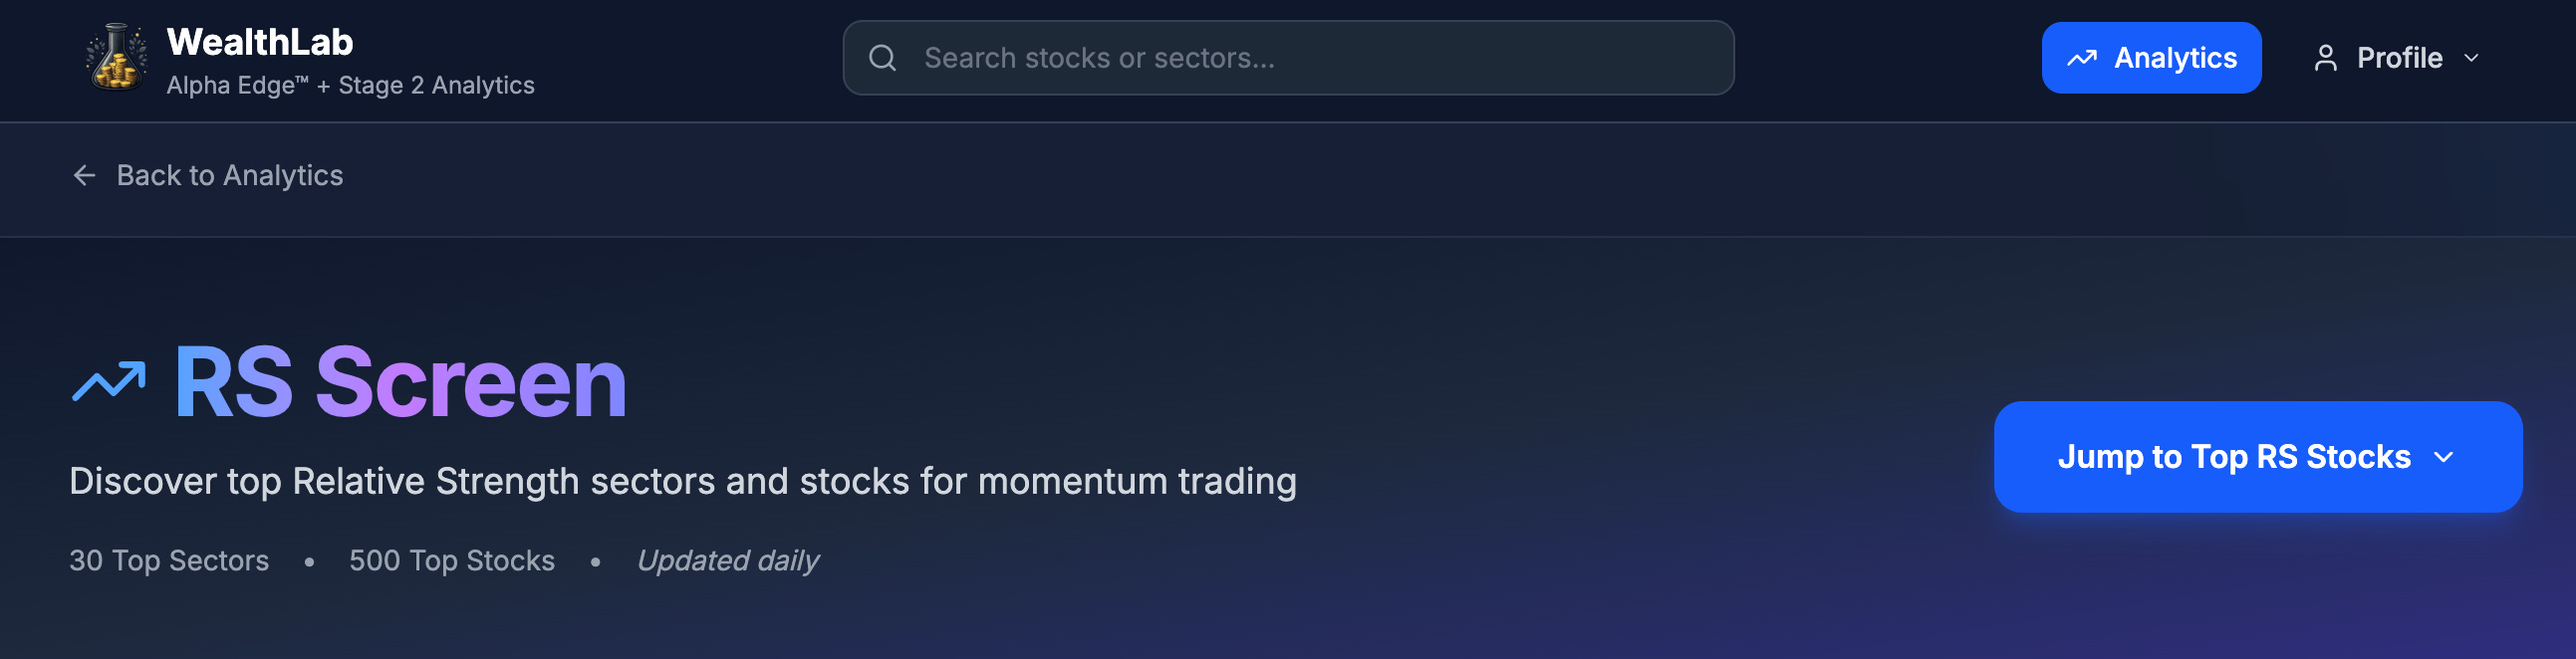
Visit WealthLab to see today’s RS leaders
Stage 2: The Sweet Spot Where Money Is Made
Okay, so you understand RS. You know how to identify the fastest runners in the race.
But here’s the thing: Not all fast runners are in a position to win.
Some might be sprinting too early and will burn out. Some might be peaking and about to slow down. Some might be in the wrong part of the track.
This is where Stage 2 comes in.
The Four Stages of a Stock
Every stock, literally every single one, moves through four distinct stages in its lifecycle:
Stage 1: Consolidation (The Base)
Think of this as the stock catching its breath. It’s been falling or moving sideways for a while. Institutions are quietly accumulating shares at low prices, but the public hasn’t noticed yet.
What’s happening: Supply and demand are finding balance. The stock is building a foundation.
Your action: Watch, but don’t buy yet. It’s not time.
Stage 2: Accumulation (The Breakout) ✅
This is the sweet spot. The stock breaks out of its base and starts trending upward. Institutions are actively buying. Earnings are growing. The sector is gaining momentum.
What’s happening: Demand exceeds supply. Every dip gets bought. The trend is your friend.
Your action: This is where you buy. This is where 80% of the money is made.
Stage 3: Distribution (The Top)
The party’s over, but nobody wants to admit it. The stock is still making new highs, but institutions are quietly selling into strength. Retail investors are piling in, chasing the “hot stock.”
What’s happening: Supply is starting to exceed demand. Smart money is exiting.
Your action: Sell. Take profits. Move on.
Stage 4: Decline (The Fall)
The stock is in free fall. Everyone who wanted to sell has sold. The only buyers are “value investors” trying to catch a falling knife.
What’s happening: No demand. Only supply. Pain.
Your action: Avoid at all costs. Don’t try to be a hero.
Why Stage 2 Is Everything
Here’s the crucial insight:
You can have a stock with high RS, but if it’s in Stage 3 or 4, you’ll still lose money.
RS tells you what is moving. Stage tells you when to buy it.
Look at this visual representation: (Made via AI xD)
Stage 1: ────────── (sideways, consolidating)
                   ↓
Stage 2:          ↗↗↗↗↗ (trending up, buy here!)
                      ↓
Stage 3:              ───↗─↘─ (topping, volatile)
                              ↓
Stage 4:                      ↘↘↘↘ (declining, avoid!)
The magic happens when you combine both:
High RS (>80) + Stage 2 = Explosive growth potential
This is what WealthLab tracks automatically. Every. Single. Day.
Real Example: The Stage 2 Breakout
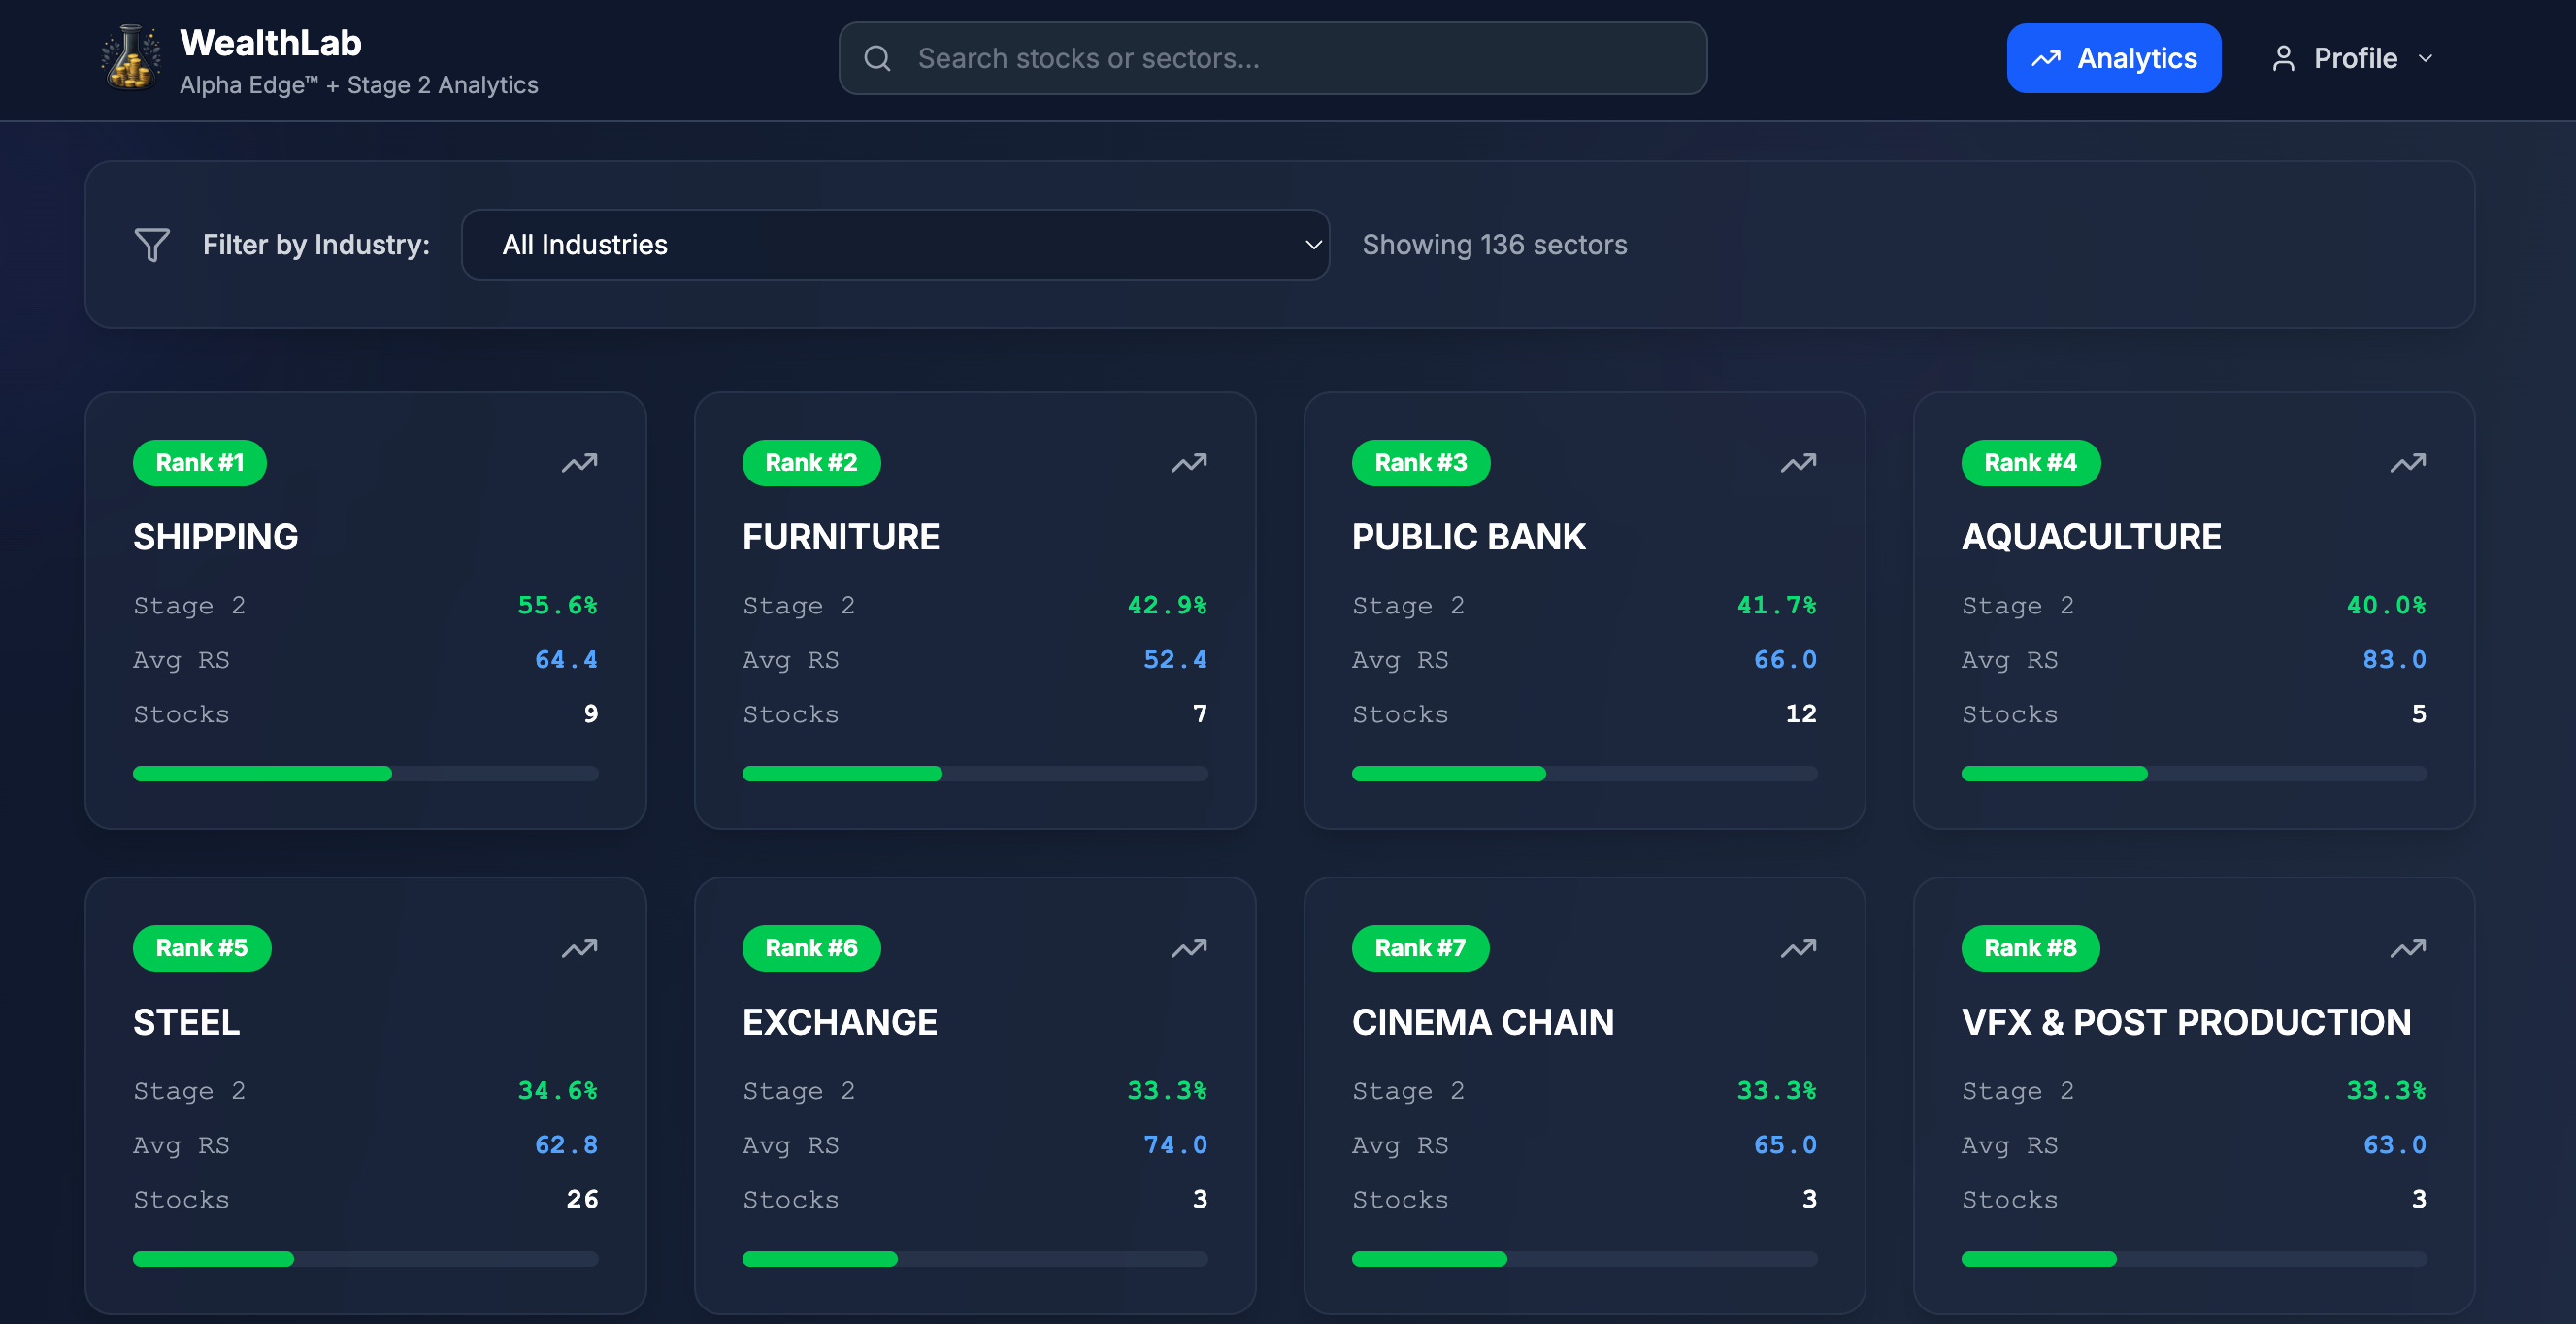
Let me walk you through a recent example from the Steel sector.
In early January 2026, our Industry Explorer flagged Steel as a leading sector. Within Steel, the “Steel Manufacturers” sub-sector showed the strongest RS ratings.
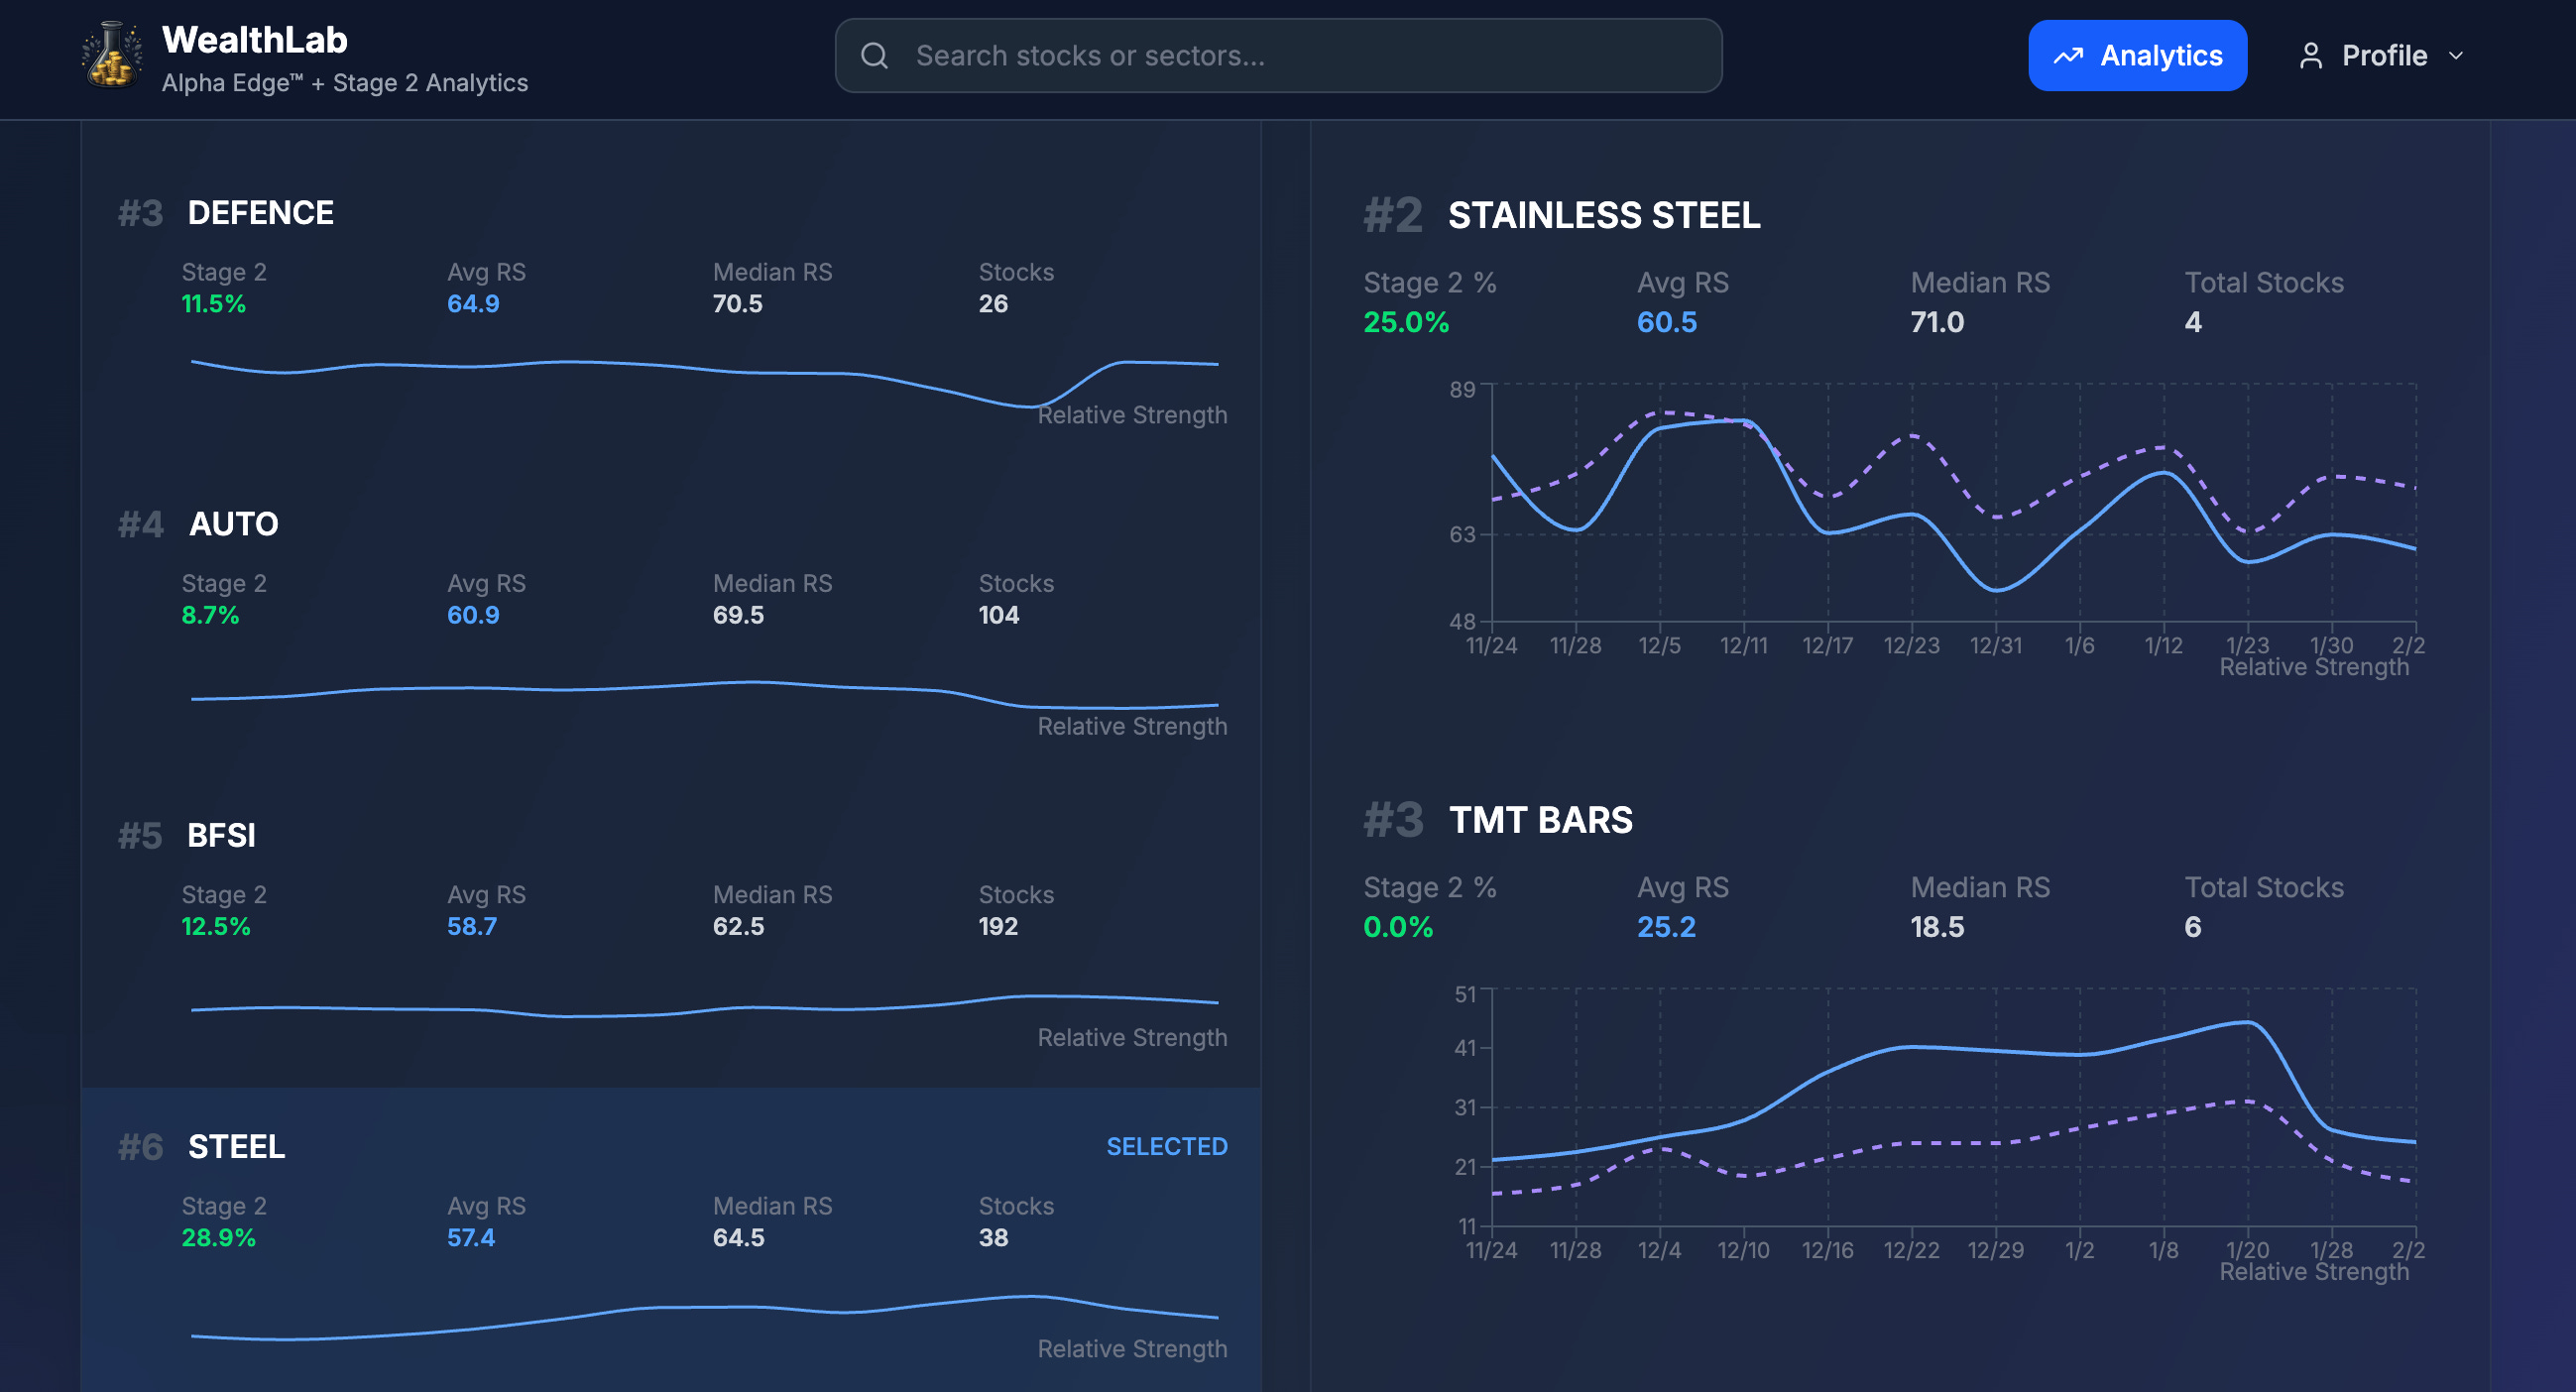
Here’s what we saw:
Stage Analysis: Multiple steel stocks were breaking out of Stage 1 bases
RS Ratings: Several had RS > 85 (top 15% of market)
Fundamentals: Earnings growing 30-40% YoY
Sector Strength: Steel was one of the top-performing sectors
The stocks were in early Stage 2—the absolute best entry point.
What happened next?
Those who bought when the stocks entered Stage 2 saw immediate gains. Those who waited until Stage 3 (when the media started talking about the “hot steel stocks”) bought near the top and are now sitting on losses.
Timing is everything. Stage 2 is the timing.
See which sectors are in Stage 2 right now on WealthLab
The Institutional Secret: Top-Down + RS + Stage 2
Here’s how professional investors actually find winners:
Step 1: Find the leading sectors
Which industries have the most Stage 2 stocks?
Which sectors have the highest average RS?
Step 2: Find the leading stocks within those sectors
Filter for RS > 80
Confirm they’re in Stage 2
Check fundamentals (earnings, sales, margins)
Step 3: Buy and hold until Stage 3
Let the trend work for you
Don’t try to time every wiggle
Exit when the stock transitions to Stage 3
This is exactly what WealthLab automates.
Instead of spending hours manually checking charts, calculating RS, and analyzing stage transitions, you get:
Real-time RS rankings for 2,000+ stocks
Automatic Stage 2 identification with visual indicators
Sector and industry analysis showing where money is flowing
The Alpha Edge™ Report giving you instant buy/no-buy decisions
The Three Concepts Summary
Let me crystallise everything we’ve covered:
1. Relative Strength (RS Rating)
What: A score from 0-100 measuring performance vs. the market
Why: Leaders keep leading; we only buy the top 20% (RS > 80)
How: Calculated daily, factoring in price performance over multiple timeframes
2. Stage 2 (The Sweet Spot)
What: The accumulation phase, where stocks trend upward
Why: This is where 80% of gains happen; buying Stage 1 is too early, Stage 3 is too late
How: Identified by price breaking above consolidation with increasing volume
3. Sector Leadership (Fish Where the Fish Are)
What: Finding sectors and industries with the highest concentration of Stage 2 stocks
Why: Stocks move in groups; being in the right sector multiplies your edge
How: Track which sectors have the most stocks with RS > 80 and in Stage 2
Why This Changes Everything
Most investors approach the market backwards:
They find a stock they like (friend’s tip, news article, whatever)
They check if it’s “cheap” based on P/E ratio
They buy and hope it goes up
This is gambling.
Here’s the professional approach:
Find sectors where money is flowing (high Stage 2 percentage)
Find the leaders within those sectors (RS > 80)
Confirm they’re in early Stage 2 (proper entry point)
Validate fundamentals (earnings growth, ROE, margins)
Buy with confidence and let the trend do the work
WealthLab handles steps 1-3 automatically. You just need to validate and execute.
One Final Thought
The market doesn’t care about your hopes, your opinions, or your gut feelings.
It only cares about two things:
Where is money flowing? (RS)
Is it the right time to enter? (Stage 2)
Everything else is noise.
Master these two concepts, and you’ll never look at the market the same way again.
Until next time, keep hunting for leaders in Stage 2. They’re out there. Every single day.
Yours,
Saksham Ahuja
WealthLab
Want more insights like this delivered straight to your inbox? Subscribe to get weekly breakdowns on finding Stage 2 winners, sector analysis, and WealthLab updates.
What’s Your Biggest Challenge?
Is it finding stocks with high RS? Identifying Stage 2 breakouts? Or knowing when to exit? Drop a comment below and let’s discuss.